









































New to KubeDB? Please start here.
Visualize Kafka Metrics with Grafana Dashboard
KubeDB exposes Kafka metrics — including JVM, broker/topic, and KRaft controller/quorum metrics — through a JMX Exporter running as a Java agent inside each Kafka container. Once Prometheus scrapes those metrics, you can visualize them in Grafana using a pre-built KubeDB dashboard. This tutorial walks through the full setup: deploying the monitoring stack, enabling monitoring on a Kafka instance, and importing the Grafana dashboard.
Before You Begin
You need a Kubernetes cluster with
kubectlconfigured. If you do not already have a cluster, you can create one by using kind.KubeDB must be installed in your cluster with
kubedb-metricsenabled. Follow the setup guide here and make sure to include the flag below during installation:--set kubedb-metrics.enabled=truekubedb-metricscreatesMetricsConfigurationobjects for each database type, which Panopticon (Step 2) uses to expose metrics to Prometheus.To keep monitoring resources isolated, we use a separate
monitoringnamespace and deploy the database in thedemonamespace.$ kubectl create ns monitoring namespace/monitoring created $ kubectl create ns demo namespace/demo created
Note: YAML files used in this tutorial are stored in docs/examples/kafka/monitoring and docs/examples/kafka/tls folders in GitHub repository kubedb/docs.
Configuration
These two steps — deploying
kube-prometheus-stackand installing Panopticon — are shared prerequisites for all KubeDB database monitoring guides. If you have already completed them in another guide, skip to Step 1.
Step 1: Deploy kube-prometheus-stack
kube-prometheus-stack installs Prometheus, Prometheus Operator, Alertmanager, and Grafana together. This is the recommended way to get the full monitoring stack on Kubernetes.
Add the prometheus-community Helm repo and install:
$ helm repo add prometheus-community https://prometheus-community.github.io/helm-charts
$ helm repo update

$ helm upgrade --install prometheus prometheus-community/kube-prometheus-stack \
  --namespace monitoring \
  --set grafana.image.tag=7.5.5
Wait for all pods to be ready:
$ kubectl get pods -n monitoring
NAME                                                   READY   STATUS    RESTARTS   AGE
alertmanager-prometheus-kube-prometheus-alertmanager-0 2/2     Running   0          2m
prometheus-grafana-xxxx                                3/3     Running   0          2m
prometheus-kube-prometheus-operator-xxxx               1/1     Running   0          2m
prometheus-kube-prometheus-prometheus-0                2/2     Running   0          2m
prometheus-kube-state-metrics-xxxx                     1/1     Running   0          2m
Find the serviceMonitorSelector label that Prometheus uses to pick up ServiceMonitor objects. You will need this label when enabling monitoring on the Kafka instance.
$ kubectl get prometheus -n monitoring -o jsonpath='{.items[0].spec.serviceMonitorSelector}'
{"matchLabels":{"release":"prometheus"}}
The label is release: prometheus.
Step 2: Install Panopticon
Panopticon is the Appscode operator that reads MetricsConfiguration objects created by kubedb-metrics and exposes them to Prometheus. It must be installed before enabling kubedb-metrics.
$ helm repo add appscode https://charts.appscode.com/stable/
$ helm repo update

$ helm upgrade --install panopticon appscode/panopticon \
  --version v2026.4.30 \
  --namespace kubeops --create-namespace \
  --set monitoring.enabled=true \
  --set monitoring.agent=prometheus.io/operator \
  --set monitoring.serviceMonitor.labels.release=prometheus \
  --set-file license=/path/to/kubedb-license.txt \
  --wait --timeout 5m0s
Verify panopticon is running:
$ kubectl get pods -n kubeops
NAME                          READY   STATUS    RESTARTS   AGE
panopticon-xxxx               1/1     Running   0          1m
Setup
Step 1: Deploy Kafka with Monitoring Enabled
Kafka runs in KRaft mode (no ZooKeeper), so the combined broker+controller nodes need at least 3 replicas to form a working Raft quorum — this is also what lets you see meaningful data in the dashboard’s KRaft Controller and KRaft Quorum panels later on.
This example also enables TLS, so first create a self-signed Issuer that KubeDB will use to issue certificates for the cluster:
$ openssl req -x509 -nodes -days 365 -newkey rsa:2048 -keyout ./ca.key -out ./ca.crt -subj "/CN=kafka/O=kubedb"

$ kubectl create secret tls kafka-ca \
  --cert=ca.crt \
  --key=ca.key \
  --namespace=demo
secret/kafka-ca created

$ kubectl create -f https://github.com/kubedb/docs/raw/v2026.6.19/docs/examples/kafka/tls/kf-Issuer.yaml
issuer.cert-manager.io/kafka-ca-issuer created
Below is the Kafka object with monitoring configured to use Prometheus Operator.
apiVersion: kubedb.com/v1
kind: Kafka
metadata:
  name: kafka-grafana-demo
  namespace: demo
spec:
  version: "4.2.0"
  replicas: 1
  deletionPolicy: WipeOut
  storage:
    storageClassName: "local-path"
    accessModes:
    - ReadWriteOnce
    resources:
      requests:
        storage: 1Gi
  monitor:
    agent: prometheus.io/operator
    prometheus:
      serviceMonitor:
        labels:
          release: prometheus
        interval: 10s
Here,
replicas: 3deploys a 3-node combined KRaft cluster (each node acts as both broker and controller), which is required for the quorum panels to show meaningful data.monitor.agent: prometheus.io/operatortells KubeDB to create aServiceMonitorfor this instance.monitor.prometheus.exporter.portsets the port the JMX exporter serves metrics on.monitor.prometheus.serviceMonitor.labelsmust match theserviceMonitorSelectorlabel of your Prometheus (release: prometheus).monitor.prometheus.serviceMonitor.intervalsets the scrape interval to 10 seconds.
Create the Kafka instance:
$ kubectl create -f https://github.com/kubedb/docs/raw/v2026.6.19/docs/examples/kafka/monitoring/kf-with-monitoring.yaml
kafka.kubedb.com/kafka created
Wait for it to be Ready:
$ kubectl get kafka -n demo kafka
NAME    VERSION   STATUS   AGE
kafka   3.9.0     Ready    5m
KubeDB creates a stats service named {kafka-name}-stats for monitoring:
$ kubectl get svc -n demo --selector="app.kubernetes.io/instance=kafka"
NAME          TYPE        CLUSTER-IP     EXTERNAL-IP   PORT(S)                       AGE
kafka-pods    ClusterIP   None           <none>        9092/TCP,9093/TCP,29092/TCP   5m
kafka-stats   ClusterIP   10.96.10.2     <none>        56790/TCP                     5m
KubeDB also creates a ServiceMonitor in the demo namespace:
$ kubectl get servicemonitor -n demo
NAME          AGE
kafka-stats   5m
Verify it carries the correct label:
$ kubectl get servicemonitor -n demo kafka-stats -o jsonpath='{.metadata.labels}'
{"release":"prometheus", ...}
Step 2: Verify Prometheus is Scraping
Port-forward the Prometheus pod:
$ kubectl port-forward -n monitoring \
  prometheus-prometheus-kube-prometheus-prometheus-0 9090
Forwarding from 127.0.0.1:9090 -> 9090
Forwarding from [::1]:9090 -> 9090
Open http://localhost:9090/targets in your browser. Look for an entry whose service label matches kafka-stats. Its state should be UP.
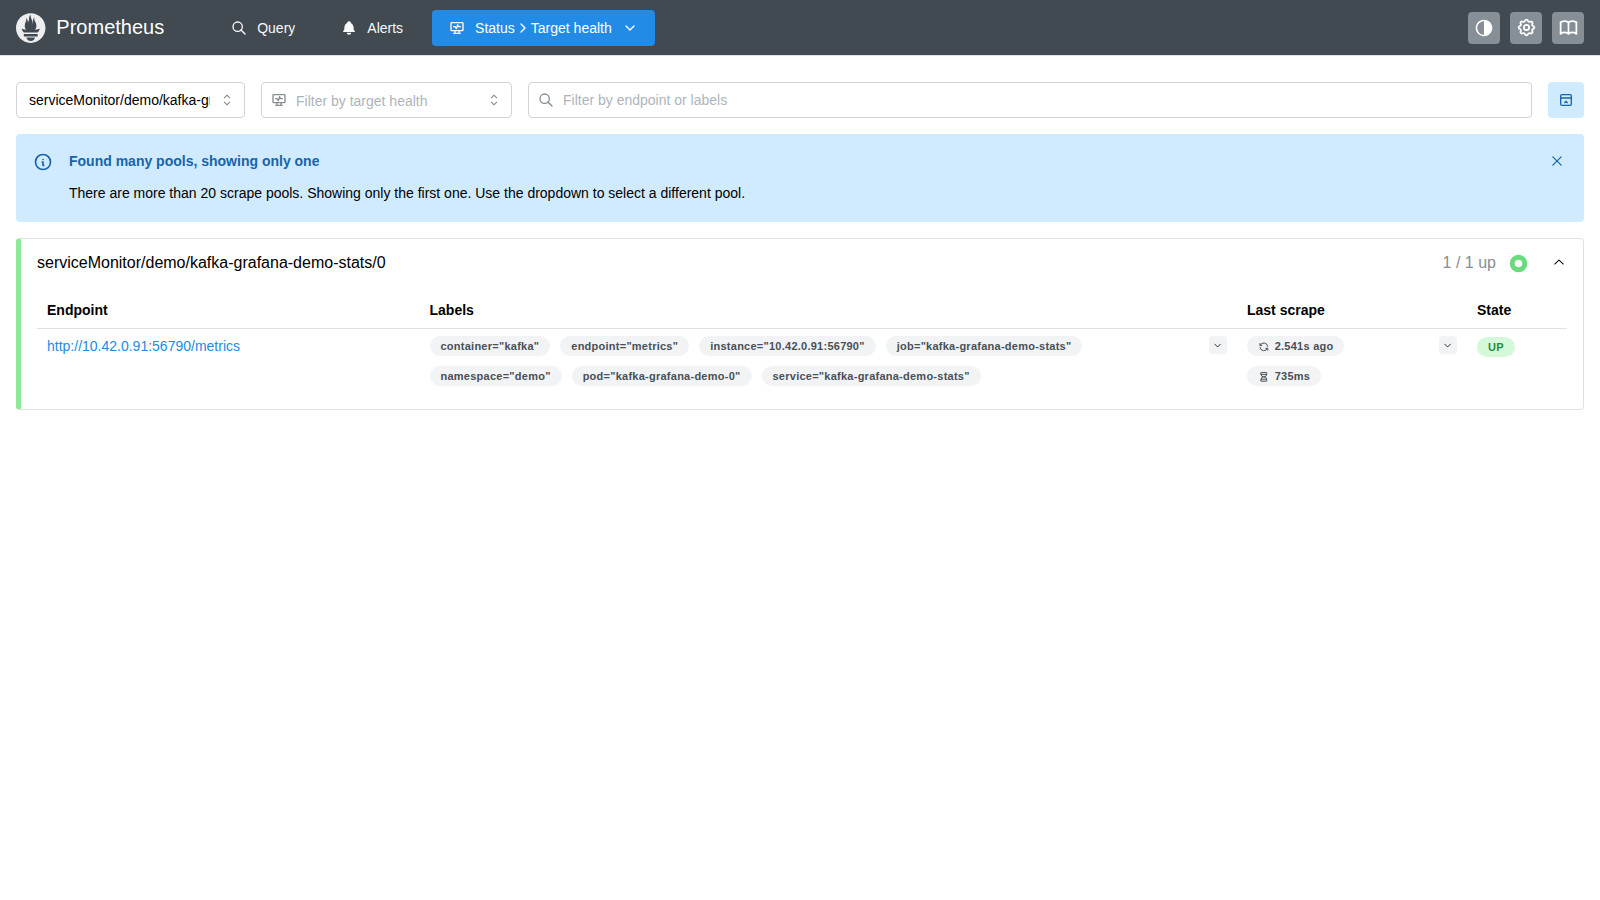
If the target is missing, check that the ServiceMonitor label (release: prometheus) matches the Prometheus serviceMonitorSelector.
Step 3: Access Grafana
Port-forward the Grafana service:
$ kubectl port-forward -n monitoring svc/prometheus-grafana 3000:80
Forwarding from 127.0.0.1:3000 -> 80
Open http://localhost:3000. The username is admin. Retrieve the auto-generated password from the secret:
$ kubectl get secret -n monitoring prometheus-grafana \
  -o jsonpath='{.data.admin-password}' | base64 -d
| Field | Value |
|---|---|
| Username | admin |
| Password | output of the command above |

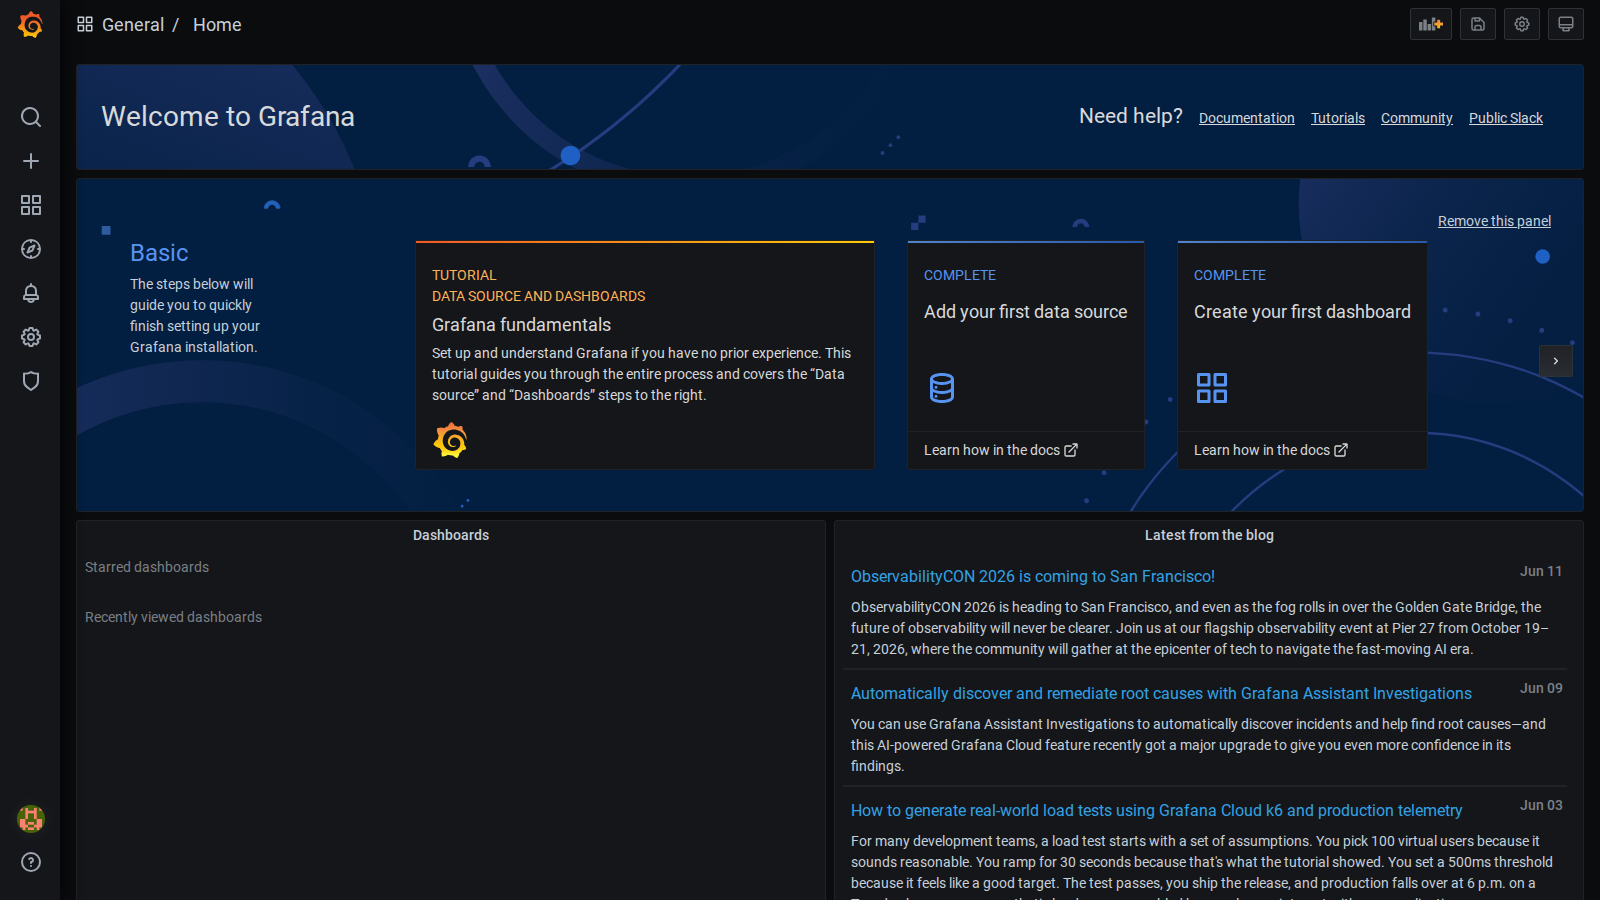
After a successful login you will see the Grafana home page:
Step 4: Configure Prometheus as a Data Source
If you installed Grafana via kube-prometheus-stack, Prometheus is already configured as the default data source — skip to Step 5.
For a standalone Grafana installation:
Go to Connections → Data sources → Add new data source.
Select Prometheus.
Set the URL to your Prometheus service:
http://prometheus-operated.monitoring.svc:9090Click Save & test. You should see
Data source is working.
Step 5: Import KubeDB Kafka Dashboard
The KubeDB Kafka dashboard is distributed as a single JSON file: kafka_database_dashboard.json in the opnpulse/dashboards repository (kafka/ folder). The JSON file is a complete dashboard definition — panels, queries, variables, and layout — that Grafana loads in one shot. Without importing, you would have to build every panel and write every PromQL query by hand. Importing lets you skip that entirely.
Download kafka_database_dashboard.json from that repository, then:
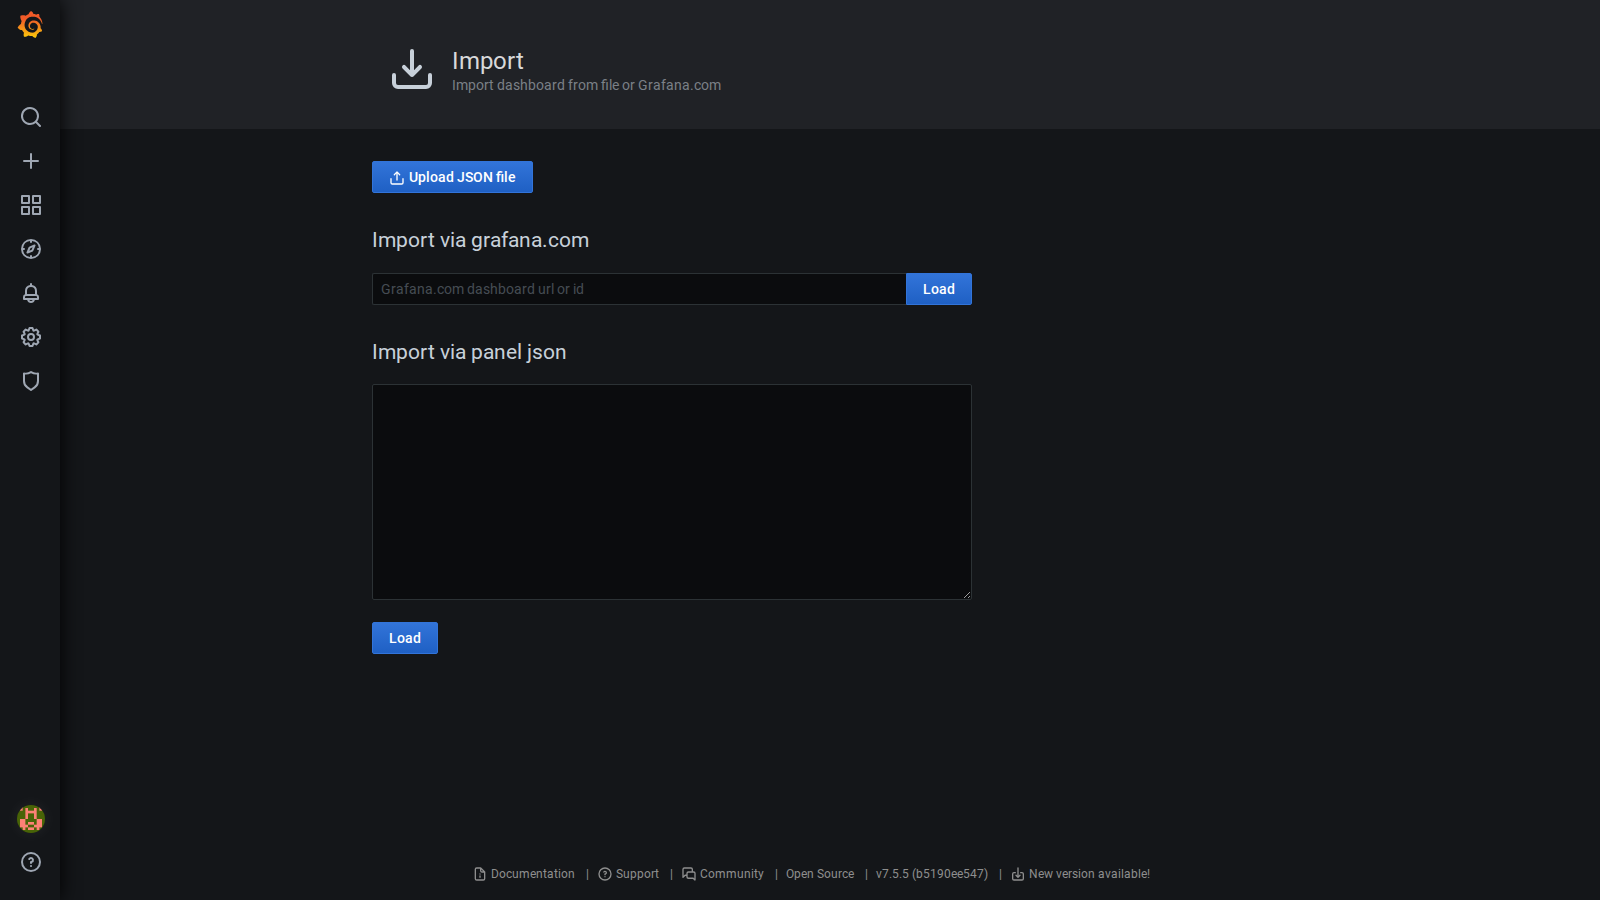
- In Grafana, click the + icon in the left sidebar and select Import.
- Click Upload JSON file and select the downloaded file.
- In the datasource dropdown that appears, select your Prometheus data source.
- Click Import.
The import page looks like this:
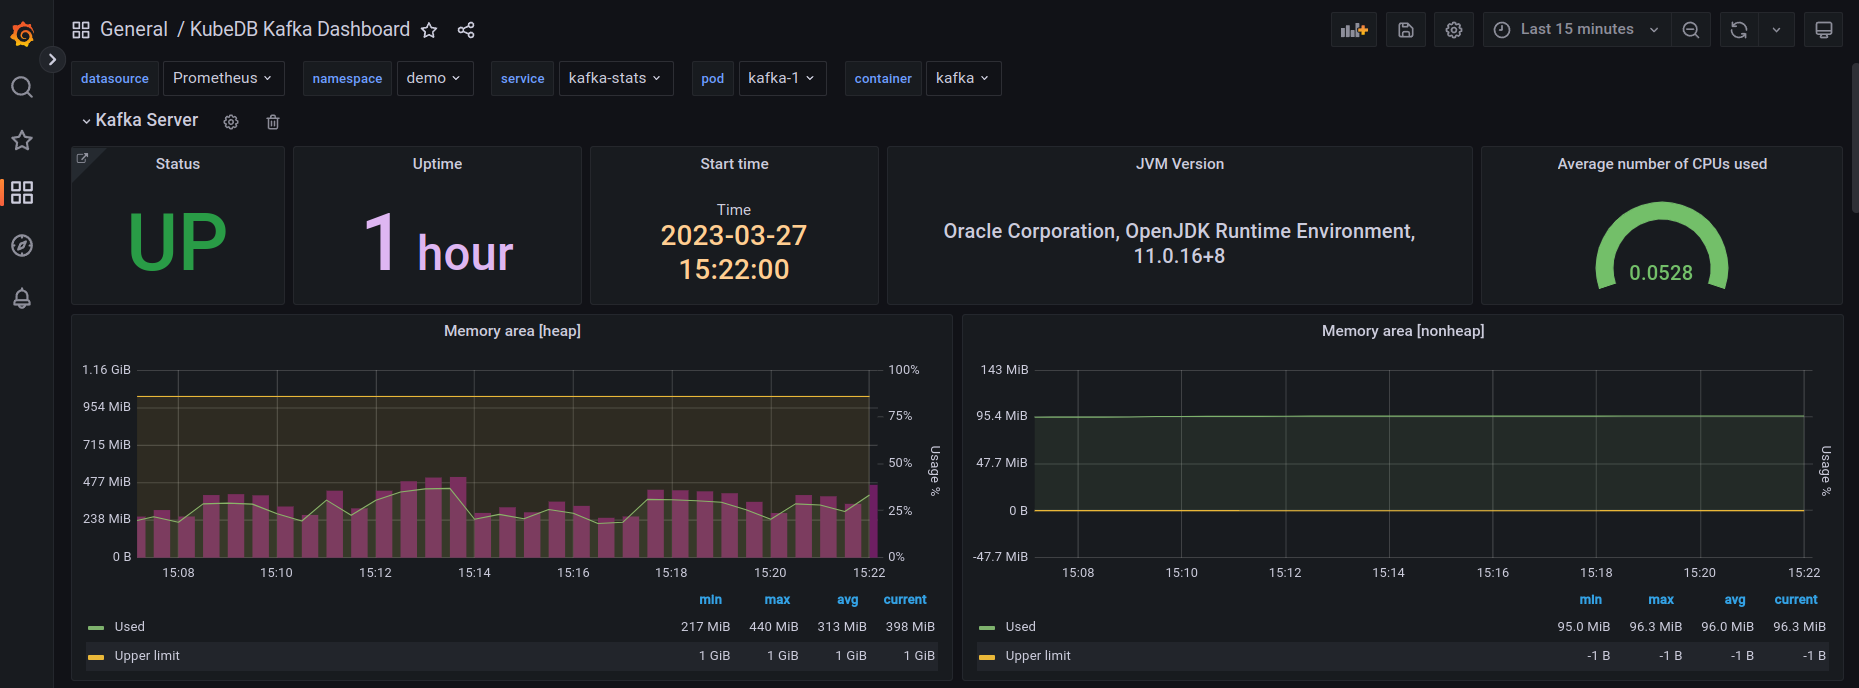
After importing, the dashboard appears as KubeDB Kafka Dashboard under Dashboards in the left sidebar. It contains four sections: Kafka Server, Broker Topic Metrics, KRaft Controller Monitoring Metrics, and KRaft Quorum Monitoring Metrics.
Step 6: Explore the Dashboard
Use the dropdown filters at the top of the dashboard to focus on a specific instance.
| Variable | What to select |
|---|---|
| datasource | Your Prometheus data source |
| namespace | Namespace where your Kafka is deployed (e.g., demo) |
| service | Stats service of your Kafka instance (e.g., kafka-stats) |
| pod | A specific broker pod, or All for an aggregated view |
| container | Container to inspect (kafka) |
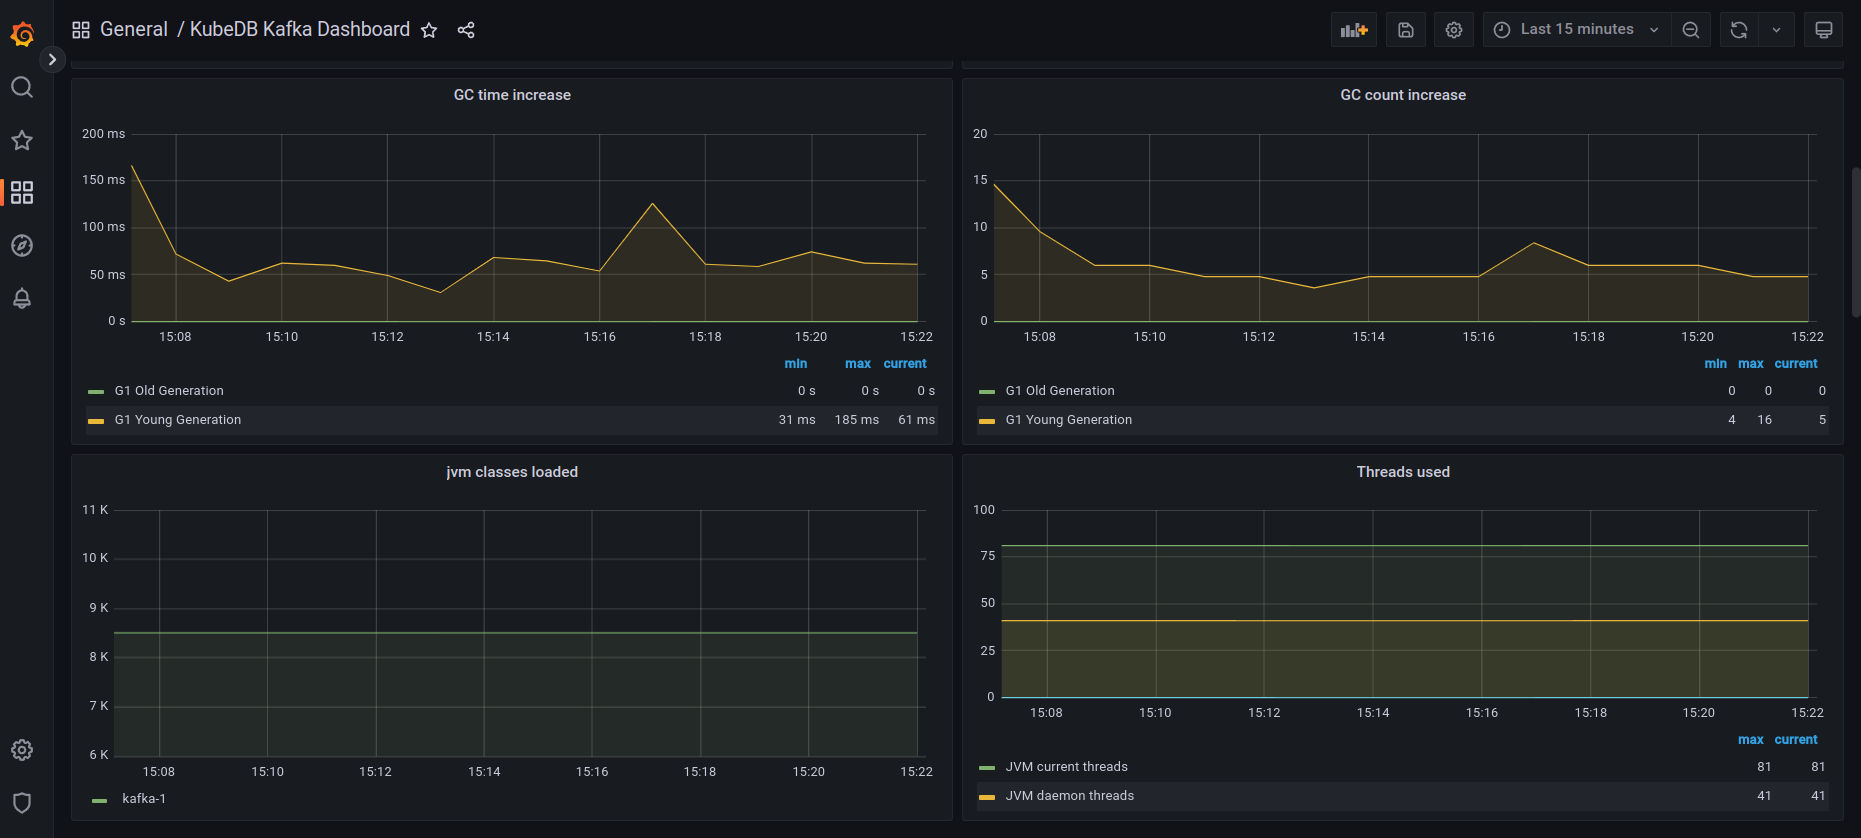
Kafka Server — JVM and process-level health of the selected broker:
- Status / Uptime / Start time — whether the broker’s JMX exporter is reachable, and how long it has been up
- JVM Version — the JVM the broker is running on
- Average number of CPUs used — CPU consumption of the process
- Memory area [heap] / [nonheap] — heap and non-heap JVM memory usage over time
- GC time increase / GC count increase — garbage collection pauses and frequency, by generation
- JVM classes loaded — number of loaded classes (a rough proxy for a leak if it keeps growing)
- Threads used — current and daemon JVM thread counts
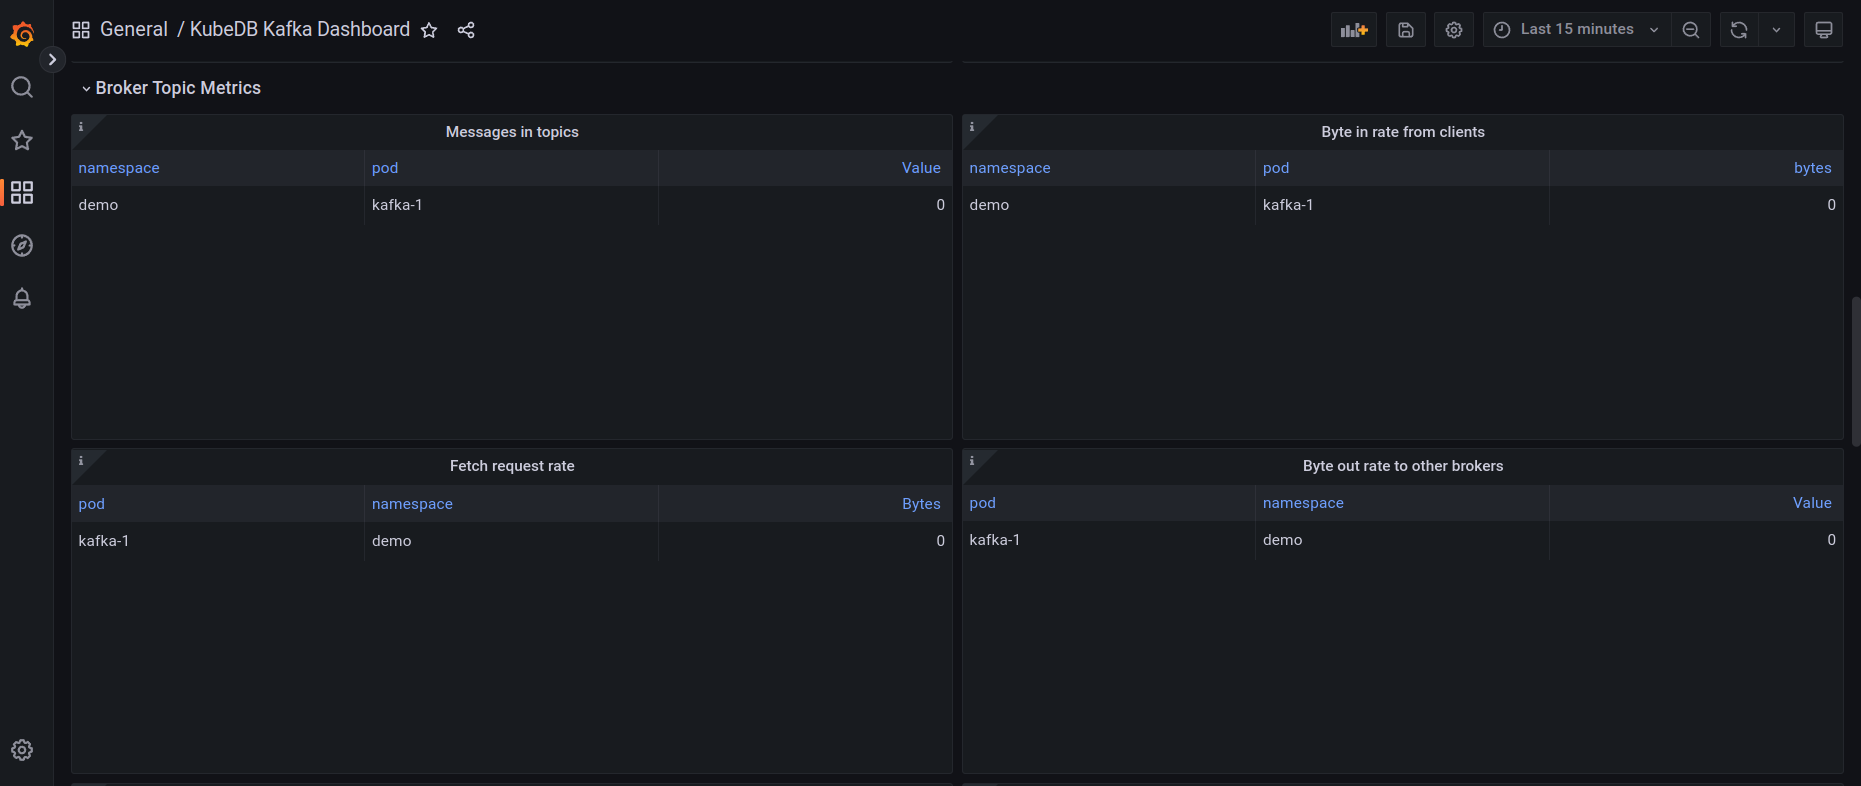
Broker Topic Metrics — throughput at the broker/topic level:
- Messages in topics — incoming message rate
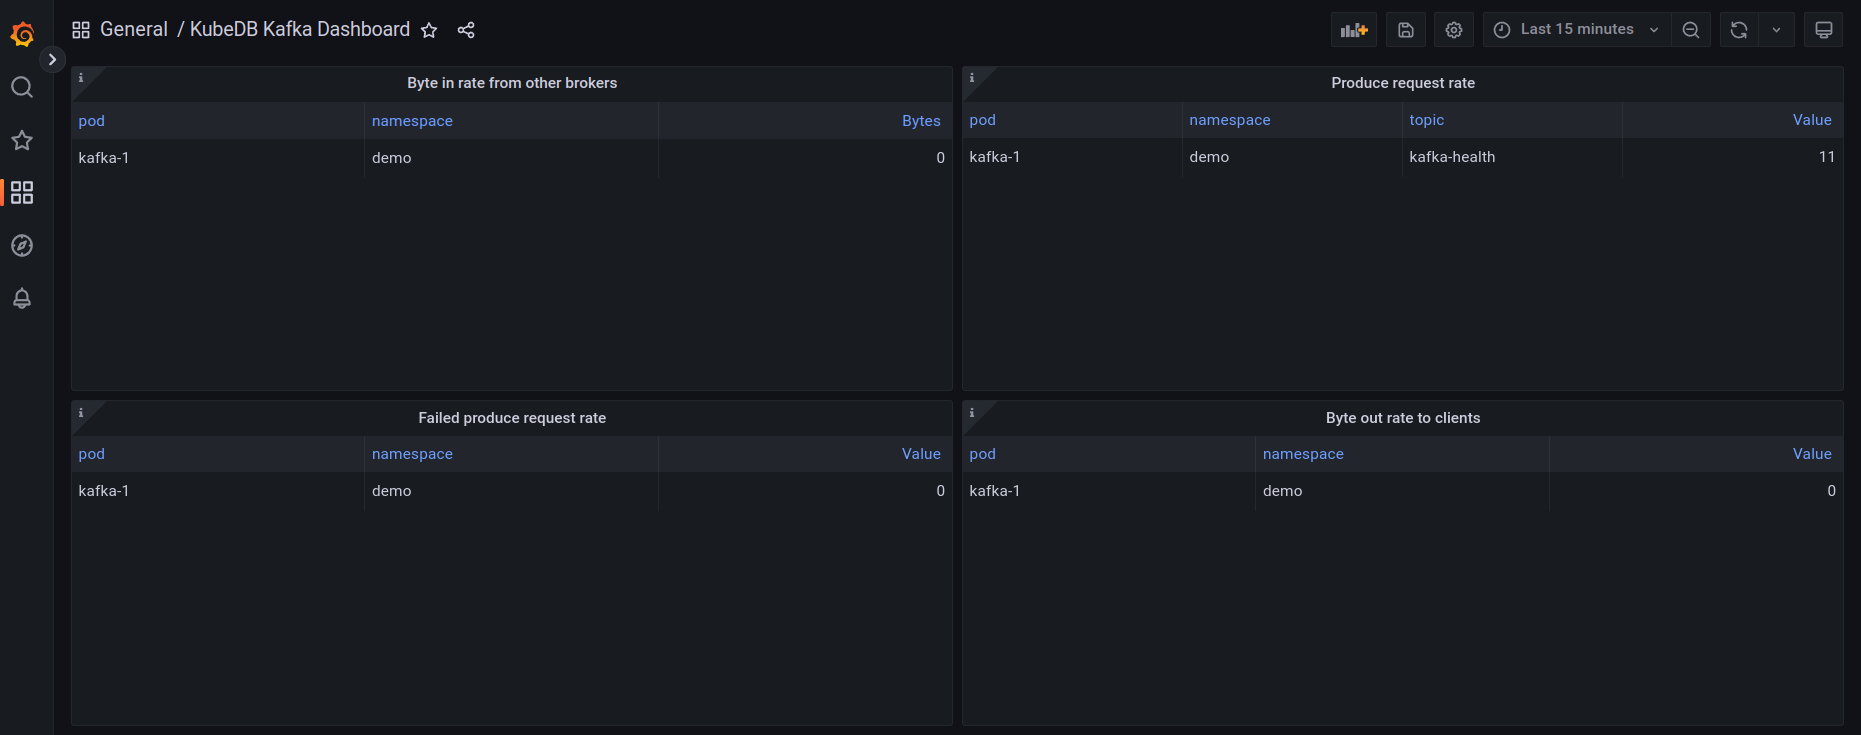
- Byte in / out rate from clients — client-facing produce/consume throughput
- Byte in / out rate from / to other brokers — inter-broker replication traffic
- Fetch request rate / Produce request rate — request throughput
- Failed produce request rate — produce requests that failed (should stay at 0)
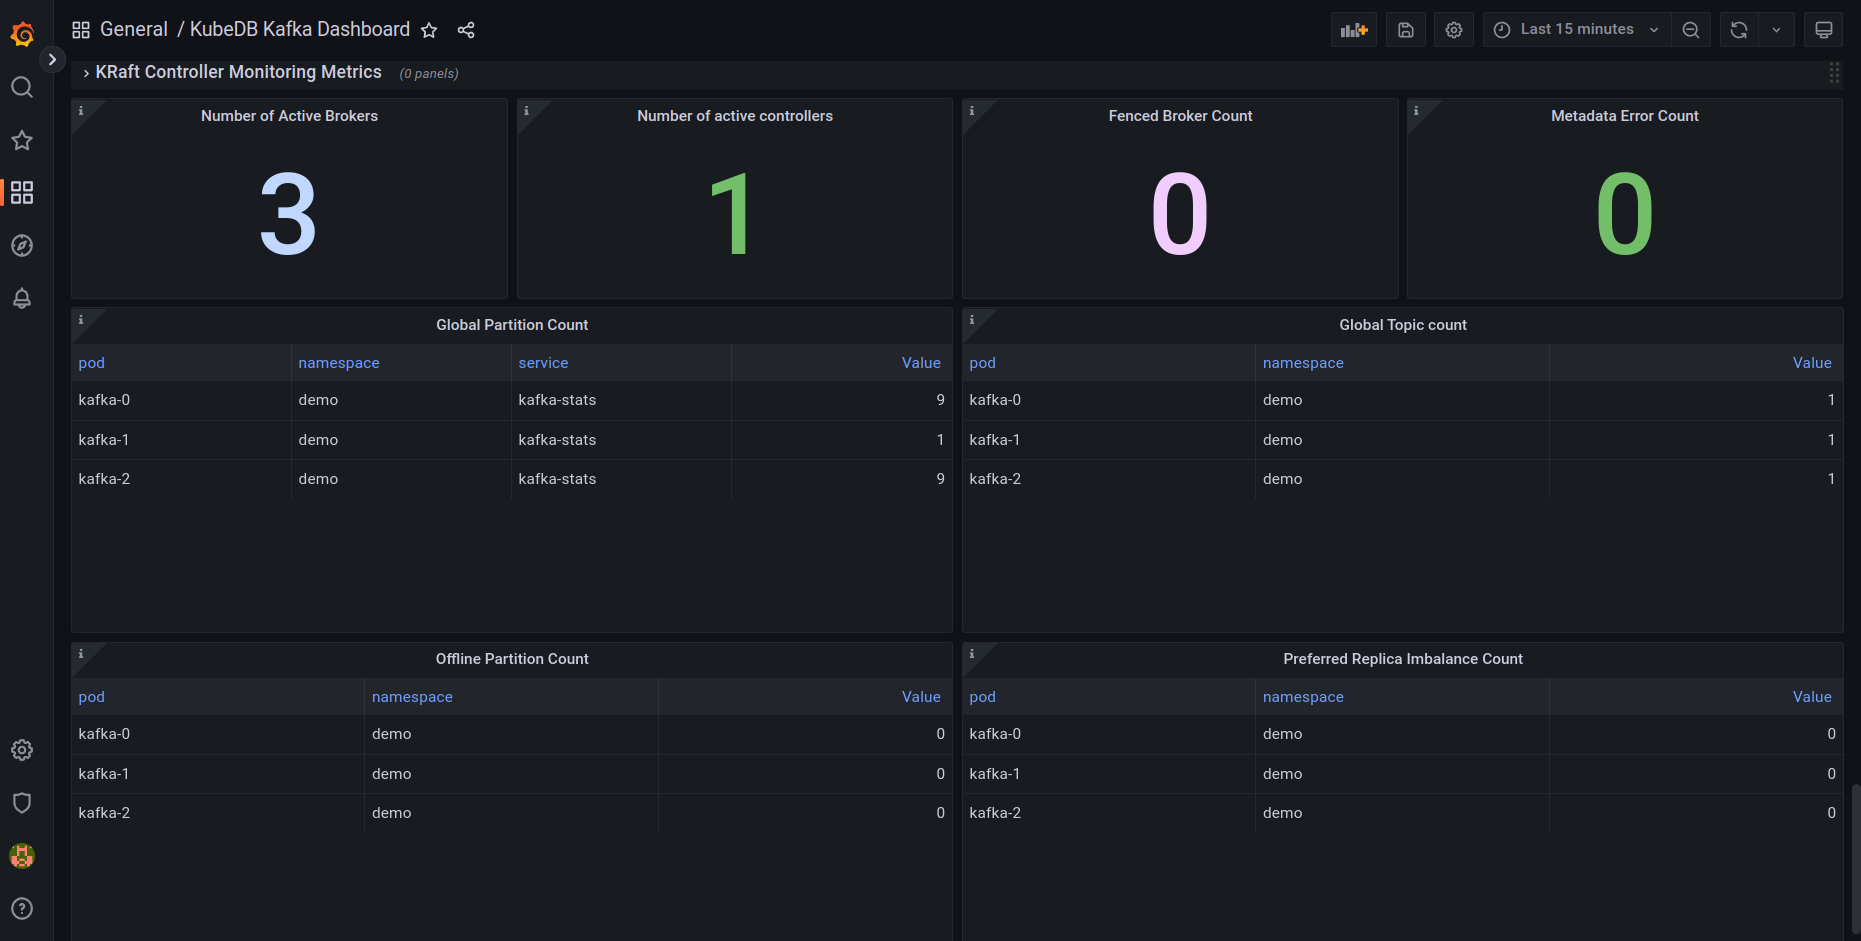
KRaft Controller Monitoring Metrics — health of the KRaft metadata quorum’s controller layer:
- Number of Active Brokers / Number of active controllers — cluster membership; exactly one broker should be the active controller
- Fenced Broker Count — brokers the controller has fenced out (non-zero means a broker is unhealthy)
- Metadata Error Count — errors while applying metadata records (should stay at 0)
- Global Partition Count / Global Topic count — partitions and topics tracked cluster-wide
- Offline Partition Count — partitions with no leader (non-zero means data unavailability)
- Preferred Replica Imbalance Count — partitions not currently led by their preferred replica
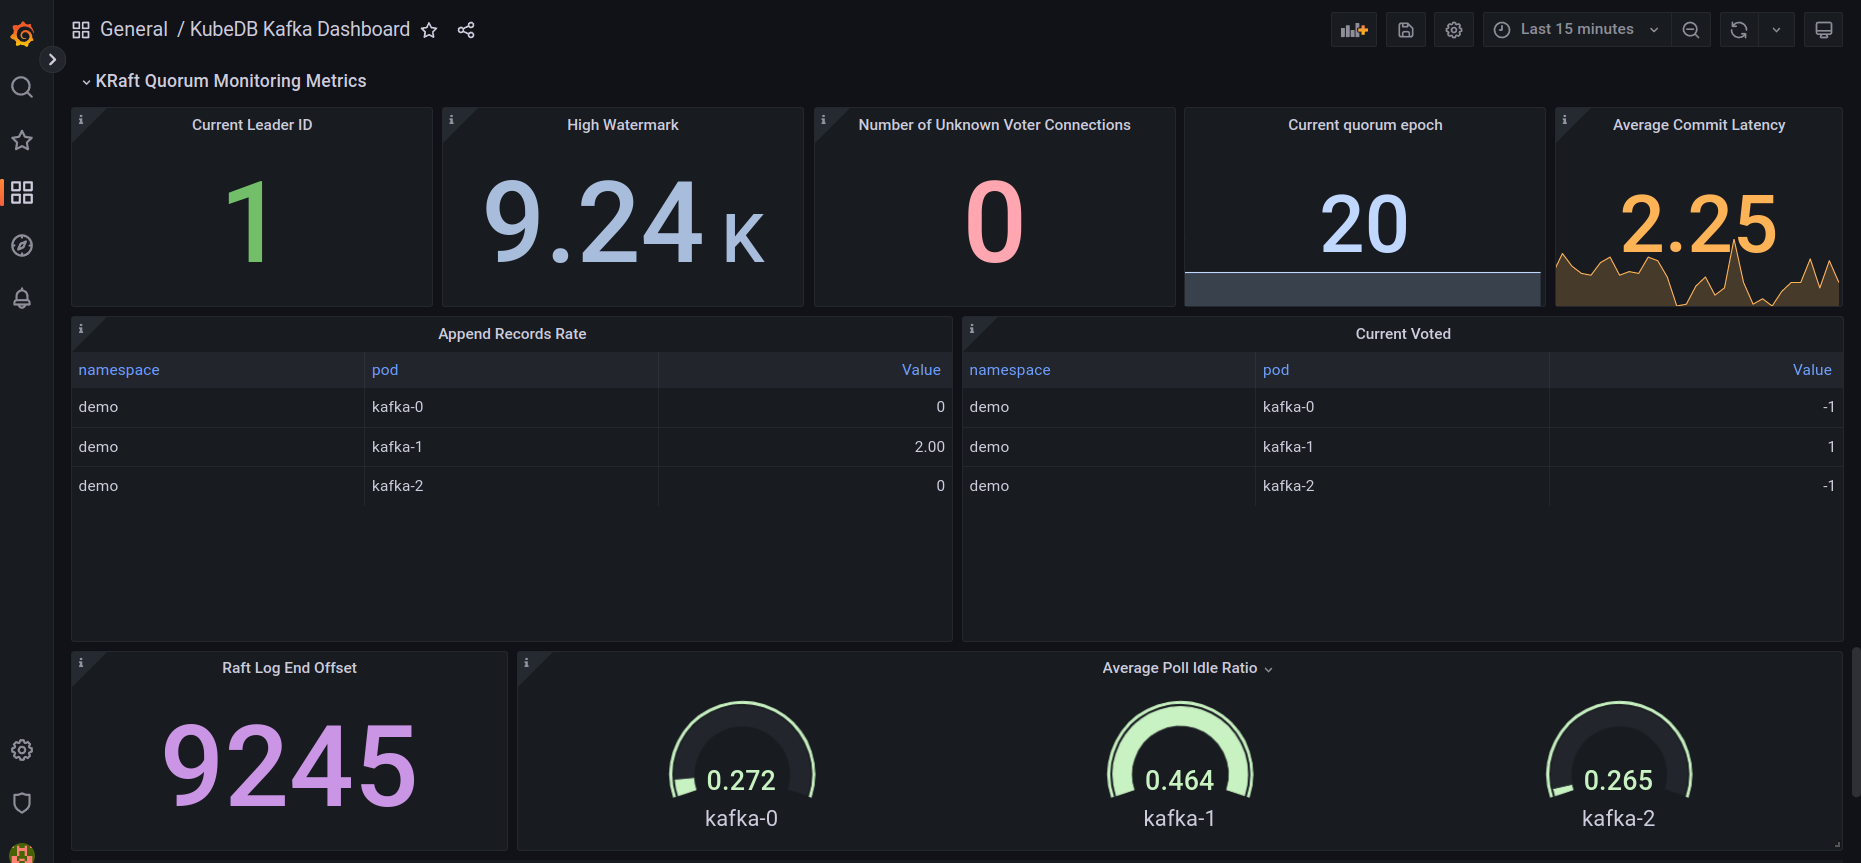
KRaft Quorum Monitoring Metrics — health of the Raft replication protocol itself:
- Current Leader ID / Current quorum epoch — which node is the metadata leader, and the current election epoch
- High Watermark / Raft Log End Offset — how far the metadata log has been committed and written
- Number of Unknown Voter Connections — connections to voters outside the current quorum (should stay at 0)
- Average Commit Latency — time to commit a metadata record to the quorum
- Append Records Rate — rate of metadata records appended to the log, per node
- Current Voted — which candidate each node voted for in the current epoch
- Average Poll Idle Ratio — fraction of time each node’s Raft I/O thread spends idle (a low value means the thread is saturated)
Cleaning up
# Remove the Kafka instance
kubectl delete kafka -n demo kafka

# Remove the issuer and CA secret
kubectl delete issuer -n demo kafka-ca-issuer
kubectl delete secret -n demo kafka-ca

# Remove namespaces
kubectl delete ns demo

# Uninstall monitoring stack (optional)
helm uninstall prometheus -n monitoring
helm uninstall panopticon -n kubeops
kubectl delete ns monitoring kubeops
Next Steps
- Monitor your Kafka instance with KubeDB using built-in Prometheus.
- Monitor your Kafka instance with KubeDB using Prometheus Operator.
- Want to hack on KubeDB? Check our contribution guidelines.