









































New to KubeDB? Please start here.
Visualize MySQL Metrics with Grafana Dashboard
KubeDB exposes MySQL metrics through a sidecar exporter. Once Prometheus scrapes those metrics, you can visualize them in Grafana using pre-built KubeDB dashboards. This tutorial walks through the full setup: deploying the monitoring stack, enabling monitoring on a MySQL instance, and importing the Grafana dashboards.
Before You Begin
You need a Kubernetes cluster with
kubectlconfigured. If you do not already have a cluster, you can create one by using kind.KubeDB must be installed in your cluster with
kubedb-metricsenabled. Follow the setup guide here and make sure to include the flag below during installation:--set kubedb-metrics.enabled=truekubedb-metricscreatesMetricsConfigurationobjects for each database type, which Panopticon (Step 2) uses to expose metrics to Prometheus.To keep monitoring resources isolated, we use a separate
monitoringnamespace and deploy the database in thedemonamespace.$ kubectl create ns monitoring namespace/monitoring created $ kubectl create ns demo namespace/demo created
Note: YAML files used in this tutorial are stored in docs/examples/mysql/monitoring folder in GitHub repository kubedb/docs.
Configuration
These two steps — deploying
kube-prometheus-stackand installing Panopticon — are shared prerequisites for all KubeDB database monitoring guides. If you have already completed them in another guide, skip to Step 1.
Step 1: Deploy kube-prometheus-stack
kube-prometheus-stack installs Prometheus, Prometheus Operator, Alertmanager, and Grafana together. This is the recommended way to get the full monitoring stack on Kubernetes.
Add the prometheus-community Helm repo and install:
$ helm repo add prometheus-community https://prometheus-community.github.io/helm-charts
$ helm repo update

$ helm upgrade --install prometheus prometheus-community/kube-prometheus-stack \
  --namespace monitoring \
  --set grafana.image.tag=7.5.5
Wait for all pods to be ready:
$ kubectl get pods -n monitoring
NAME                                                   READY   STATUS    RESTARTS   AGE
alertmanager-prometheus-kube-prometheus-alertmanager-0 2/2     Running   0          2m
prometheus-grafana-xxxx                                3/3     Running   0          2m
prometheus-kube-prometheus-operator-xxxx               1/1     Running   0          2m
prometheus-kube-prometheus-prometheus-0                2/2     Running   0          2m
prometheus-kube-state-metrics-xxxx                     1/1     Running   0          2m
Find the serviceMonitorSelector label that Prometheus uses to pick up ServiceMonitor objects. You will need this label when enabling monitoring on the MySQL instance.
$ kubectl get prometheus -n monitoring -o jsonpath='{.items[0].spec.serviceMonitorSelector}'
{"matchLabels":{"release":"prometheus"}}
The label is release: prometheus.
Step 2: Install Panopticon
Panopticon is the Appscode operator that reads MetricsConfiguration objects created by kubedb-metrics and exposes them to Prometheus. It must be installed before enabling kubedb-metrics.
$ helm repo add appscode https://charts.appscode.com/stable/
$ helm repo update

$ helm upgrade --install panopticon appscode/panopticon \
  --version v2026.4.30 \
  --namespace kubeops --create-namespace \
  --set monitoring.enabled=true \
  --set monitoring.agent=prometheus.io/operator \
  --set monitoring.serviceMonitor.labels.release=prometheus \
  --set-file license=/path/to/kubedb-license.txt \
  --wait --timeout 5m0s
Verify panopticon is running:
$ kubectl get pods -n kubeops
NAME                          READY   STATUS    RESTARTS   AGE
panopticon-xxxx               1/1     Running   0          1m
Setup
Step 1: Deploy MySQL with Monitoring Enabled
Below is the MySQL object with monitoring configured to use Prometheus Operator.
apiVersion: kubedb.com/v1
kind: MySQL
metadata:
  name: mysql-grafana-demo
  namespace: demo
spec:
  version: "9.6.0"
  deletionPolicy: WipeOut
  storage:
    storageClassName: "standard"
    accessModes:
    - ReadWriteOnce
    resources:
      requests:
        storage: 1Gi
  monitor:
    agent: prometheus.io/operator
    prometheus:
      serviceMonitor:
        labels:
          release: prometheus
        interval: 10s
Here,
monitor.agent: prometheus.io/operatortells KubeDB to create aServiceMonitorfor this instance.monitor.prometheus.serviceMonitor.labelsmust match theserviceMonitorSelectorlabel of your Prometheus (release: prometheus).monitor.prometheus.serviceMonitor.intervalsets the scrape interval to 10 seconds.
Create the MySQL instance:
$ kubectl create -f https://github.com/kubedb/docs/raw/v2026.6.19/docs/examples/mysql/monitoring/coreos-prom-mysql.yaml
mysql.kubedb.com/mysql-grafana-demo created
Wait for it to be Ready:
$ kubectl get mysql -n demo mysql-grafana-demo
NAME                 VERSION   STATUS   AGE
mysql-grafana-demo   9.6.0     Ready    2m
KubeDB creates a stats service named {mysql-name}-stats for the exporter:
$ kubectl get svc -n demo --selector="app.kubernetes.io/instance=mysql-grafana-demo"
NAME                       TYPE        CLUSTER-IP     EXTERNAL-IP   PORT(S)     AGE
mysql-grafana-demo         ClusterIP   10.96.10.1     <none>        3306/TCP    2m
mysql-grafana-demo-stats   ClusterIP   10.96.10.2     <none>        9104/TCP    2m
KubeDB also creates a ServiceMonitor in the demo namespace:
$ kubectl get servicemonitor -n demo
NAME                       AGE
mysql-grafana-demo-stats   2m
Verify it carries the correct label:
$ kubectl get servicemonitor -n demo mysql-grafana-demo-stats -o jsonpath='{.metadata.labels}'
{"release":"prometheus", ...}
Step 2: Verify Prometheus is Scraping
Port-forward the Prometheus pod:
$ kubectl port-forward -n monitoring \
  prometheus-prometheus-kube-prometheus-prometheus-0 9090
Forwarding from 127.0.0.1:9090 -> 9090
Forwarding from [::1]:9090 -> 9090
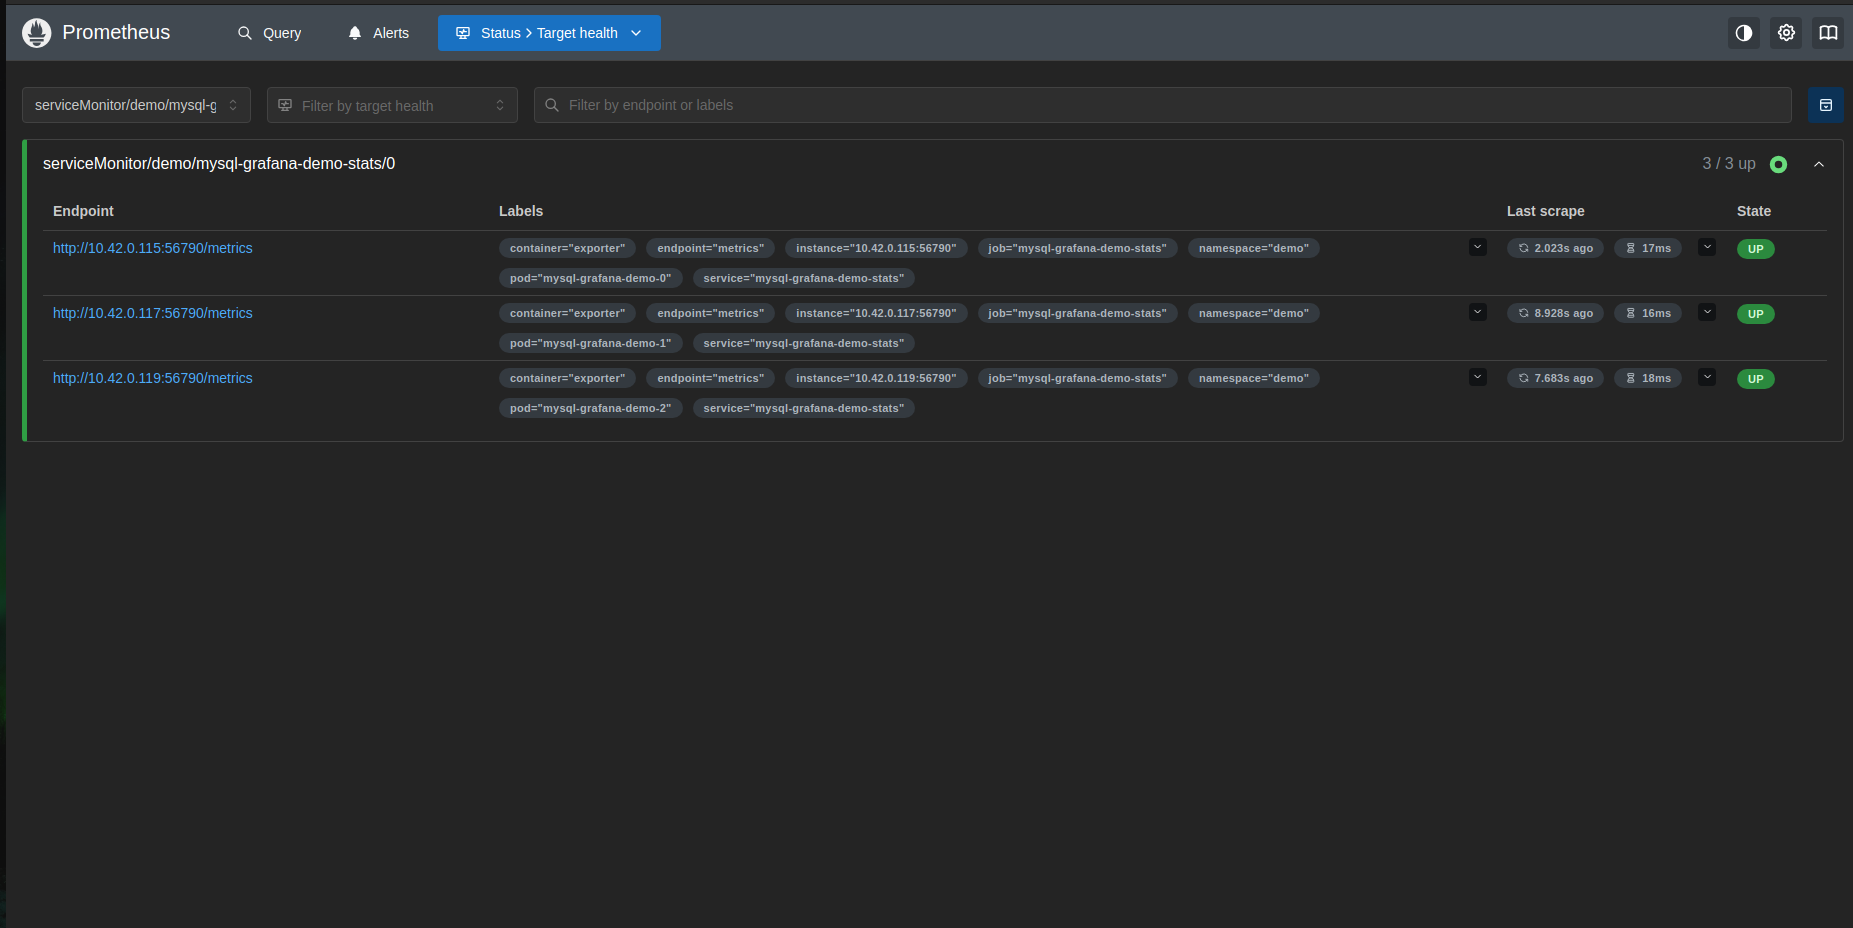
Open http://localhost:9090/targets in your browser. Look for an entry whose service label matches mysql-grafana-demo-stats. Its state should be UP.
If the target is missing, check that the ServiceMonitor label (release: prometheus) matches the Prometheus serviceMonitorSelector.
Step 3: Access Grafana
Port-forward the Grafana service:
$ kubectl port-forward -n monitoring svc/prometheus-grafana 3000:80
Forwarding from 127.0.0.1:3000 -> 80
Open http://localhost:3000. The username is admin. Retrieve the auto-generated password from the secret:
$ kubectl get secret -n monitoring prometheus-grafana \
  -o jsonpath='{.data.admin-password}' | base64 -d
| Field | Value |
|---|---|
| Username | admin |
| Password | output of the command above |

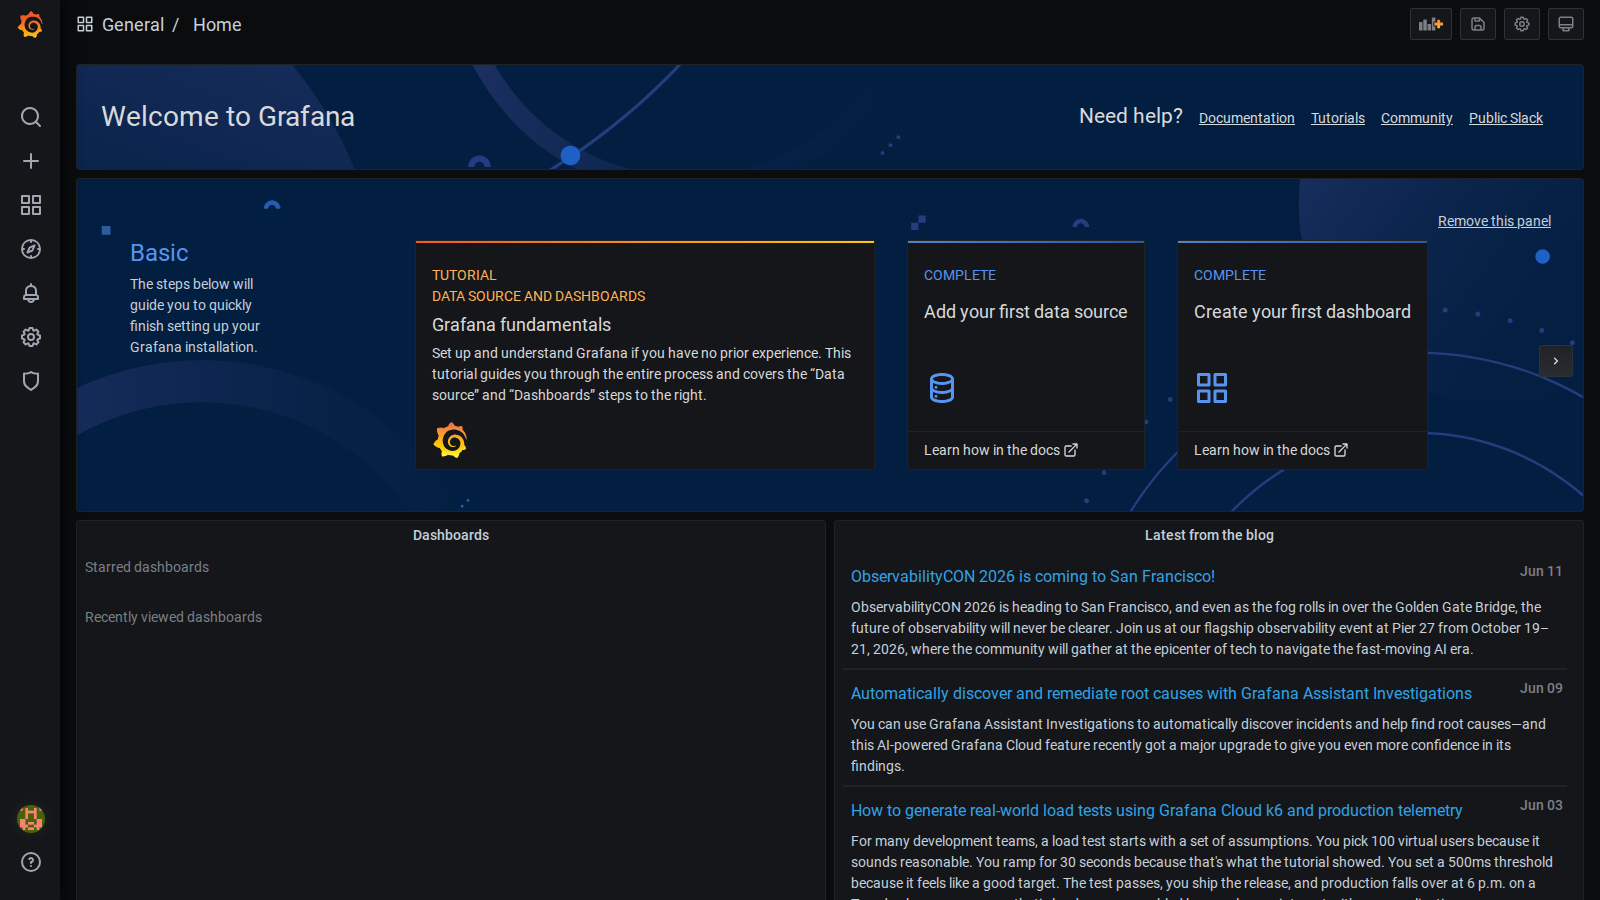
After a successful login you will see the Grafana home page:
Step 4: Configure Prometheus as a Data Source
If you installed Grafana via kube-prometheus-stack, Prometheus is already configured as the default data source — skip to Step 5.
For a standalone Grafana installation:
Go to Connections → Data sources → Add new data source.
Select Prometheus.
Set the URL to your Prometheus service:
http://prometheus-operated.monitoring.svc:9090Click Save & test. You should see
Data source is working.
Step 5: Import KubeDB MySQL Dashboard
The KubeDB MySQL dashboards are distributed as JSON files. Each JSON file is a complete dashboard definition — panels, queries, variables, and layout — that Grafana loads in one shot. Without importing, you would have to build every panel and write every PromQL query by hand. Importing lets you skip that entirely.
Four dashboards are available. Download all JSON files from the appscode/grafana-dashboards repository (mysql/ folder):
| File | Dashboard |
|---|---|
mysql_summary_dashboard.json | KubeDB / MySQL / Summary |
mysql_pods_dashboard.json | KubeDB / MySQL / Pod |
mysql_databases_dashboard.json | KubeDB / MySQL / Database |
mysql_group_replication_dashboard.json | KubeDB / MySQL / Group Replication |
The Group Replication dashboard is only relevant for MySQL Group Replication deployments (
spec.topology.mode: GroupReplication).
Import steps (repeat for each file):
- In Grafana, click the
+icon in the left sidebar. - Select
Importfrom the menu. - Click
Upload JSON fileand select one of the downloaded.jsonfiles. - In the
Prometheusdropdown that appears, select your Prometheus data source. - Click
Import.
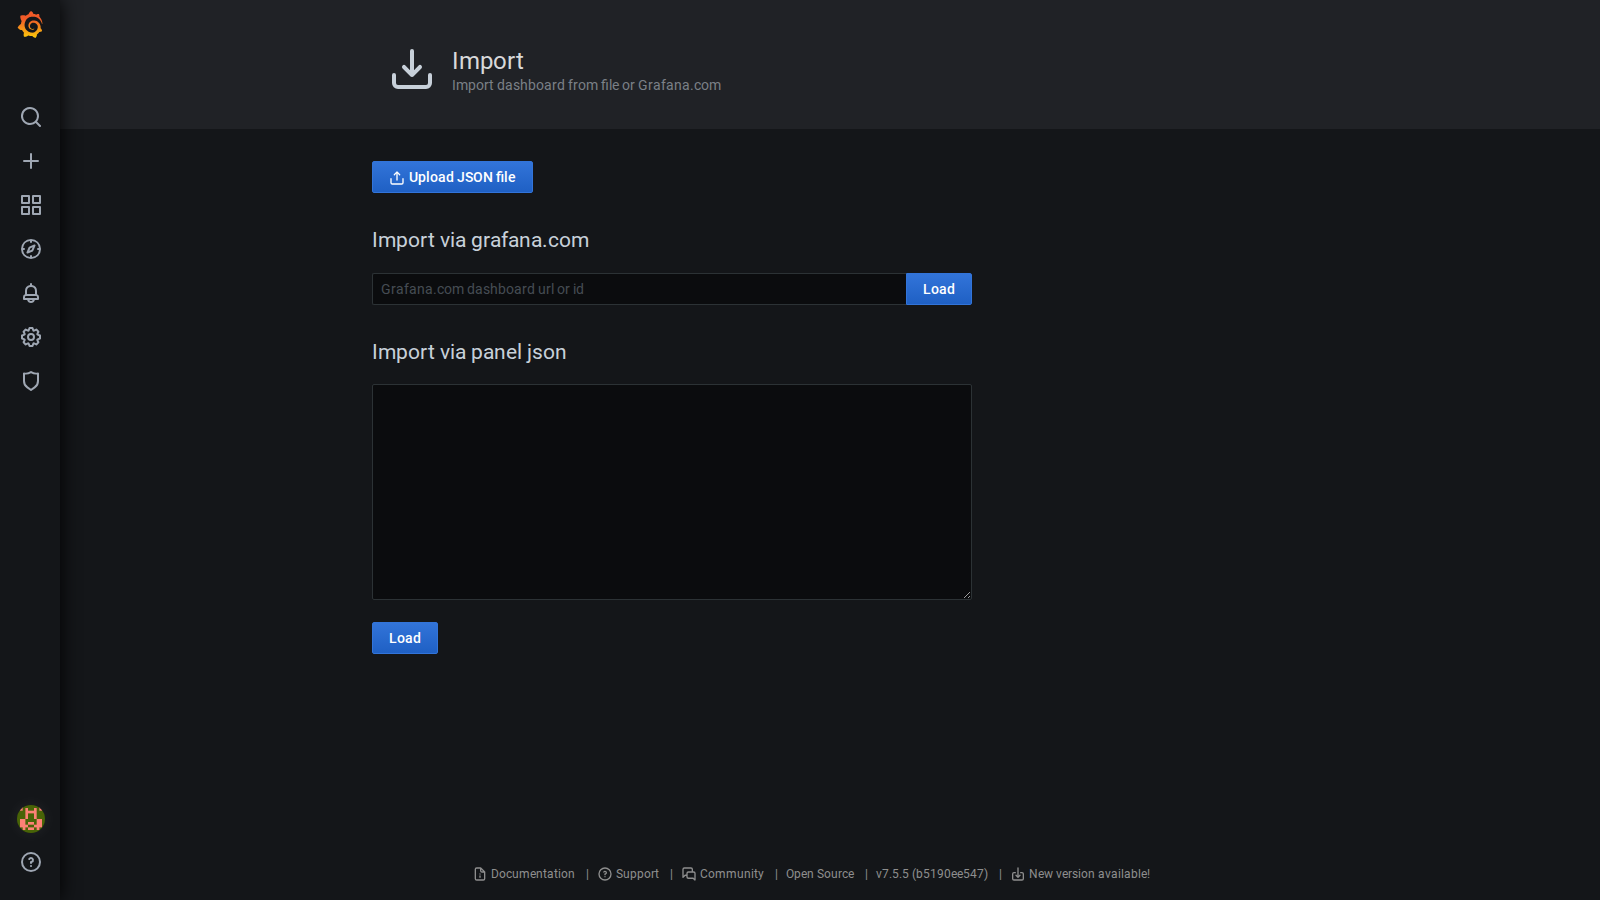
The import page looks like this — click Upload dashboard JSON file to select the file:
After importing all files, they will appear under Dashboards in the left sidebar.
| Dashboard Name | Description |
|---|---|
| KubeDB / MySQL / Summary | Instance overview: status, version, node count, resource requests/limits, CPU/memory usage |
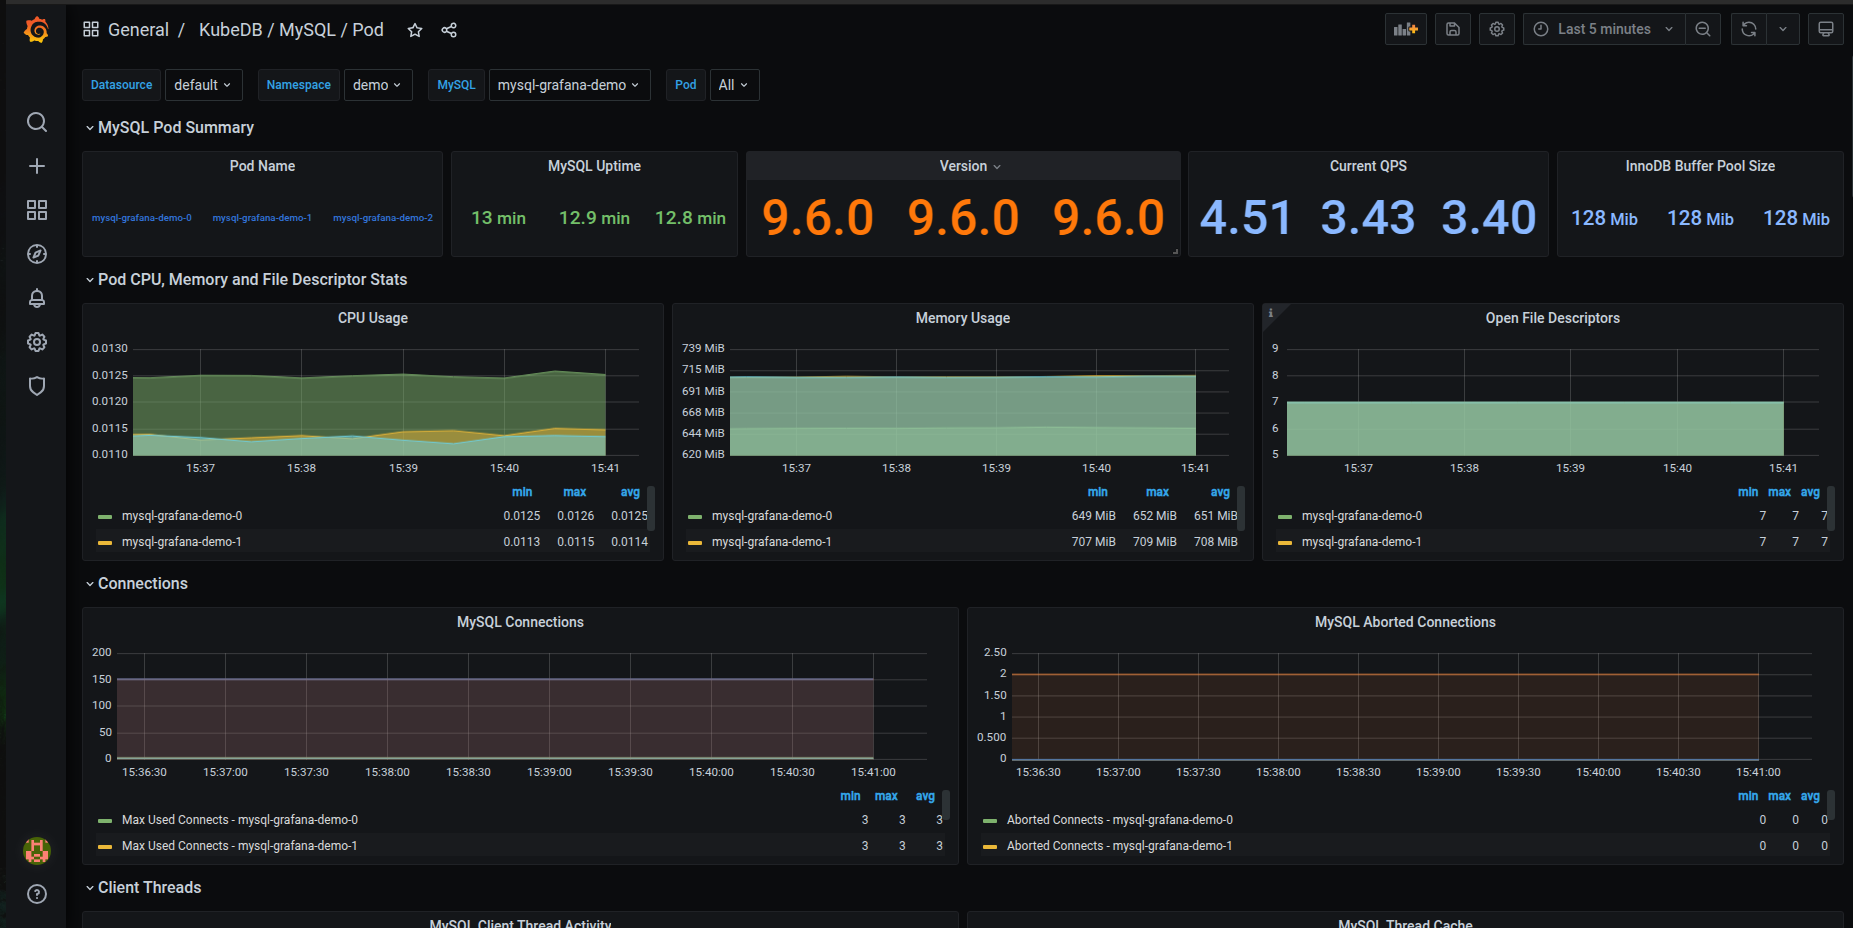
| KubeDB / MySQL / Pod | Per-pod uptime, version, QPS, InnoDB buffer pool size, CPU/memory, connections |
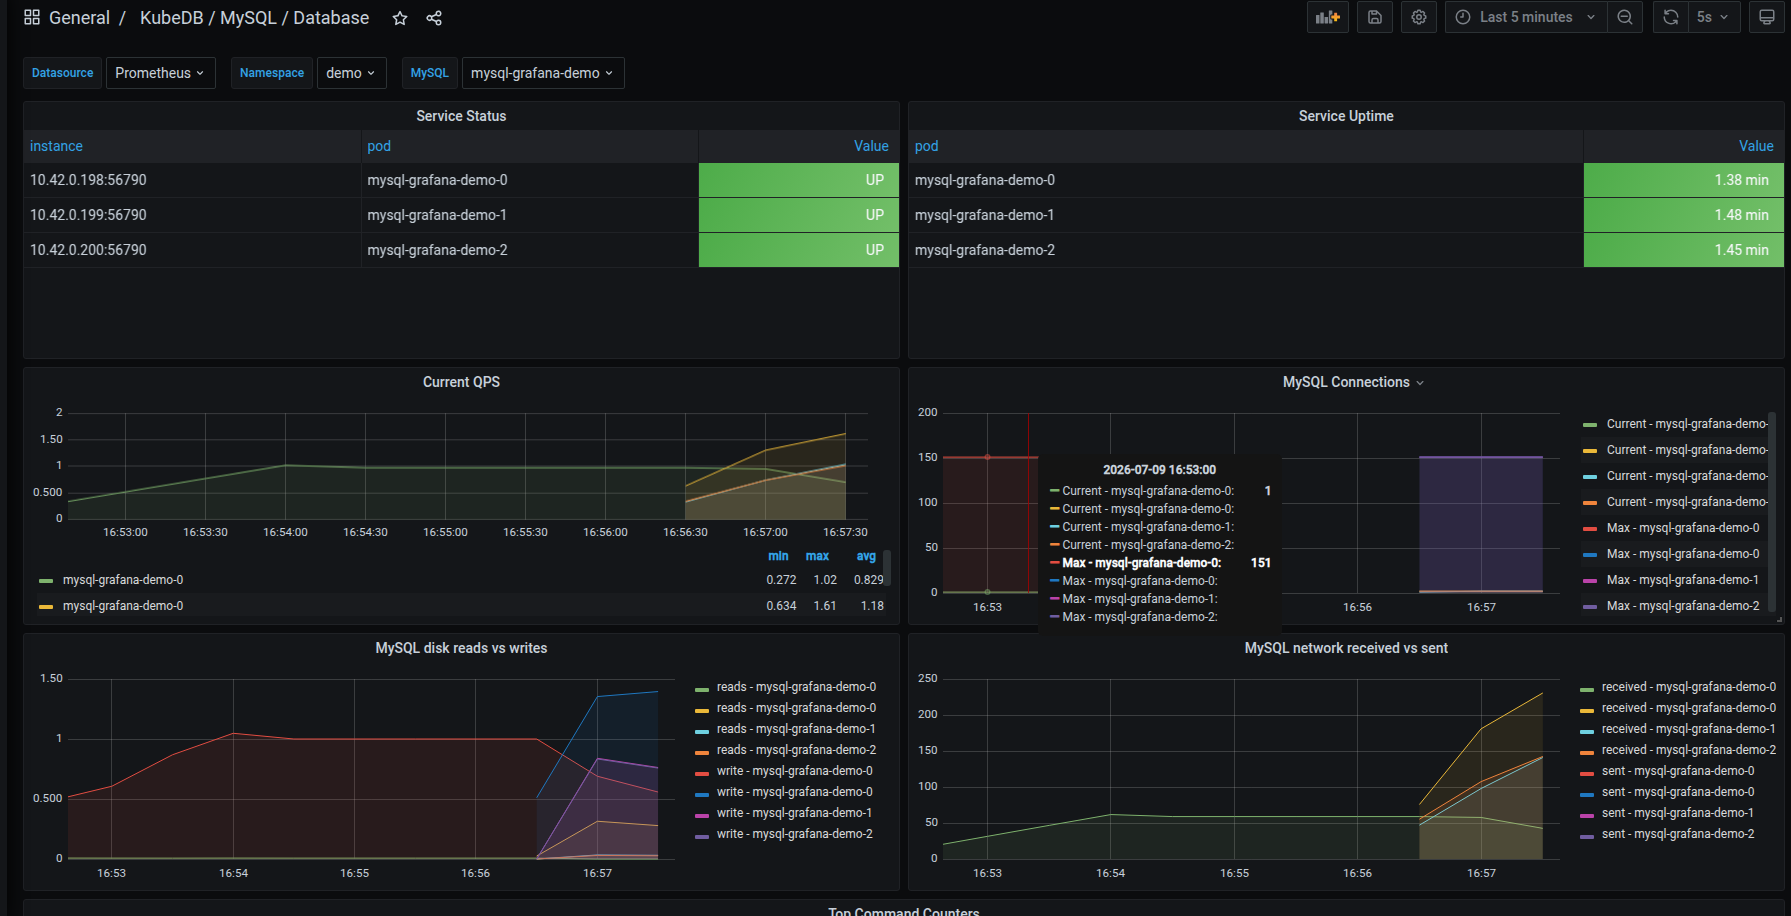
| KubeDB / MySQL / Database | Per-pod service status/uptime, QPS, connections, disk and network I/O |
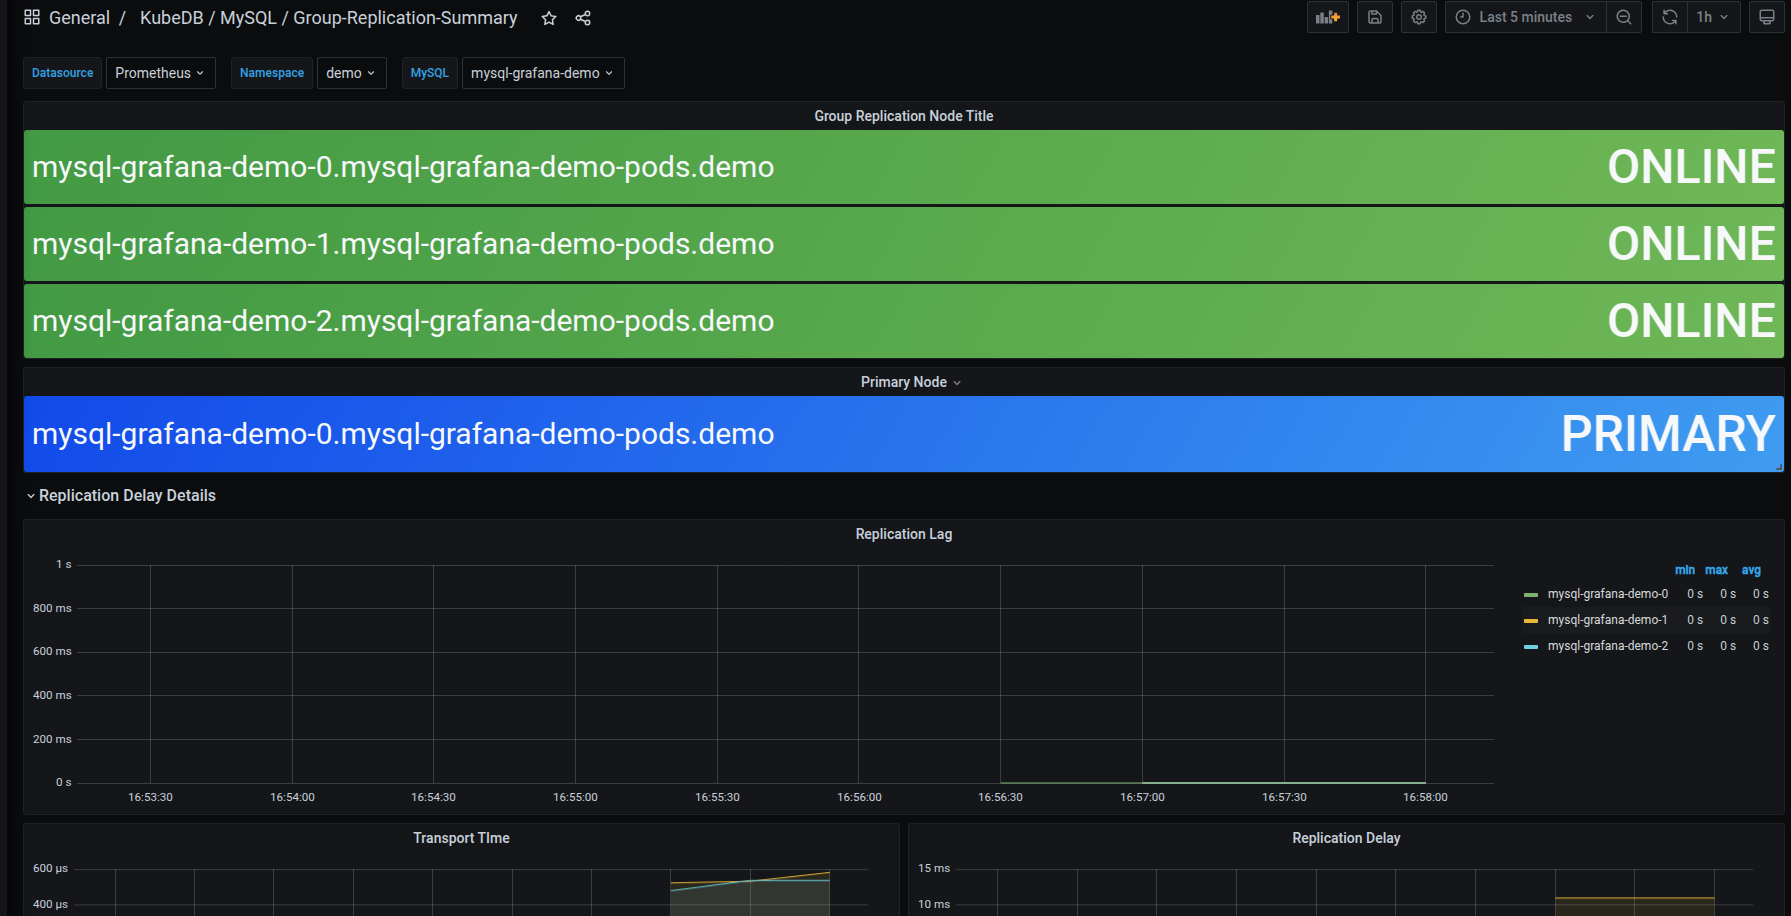
| KubeDB / MySQL / Group Replication | Group member status and primary node, replication lag, transport time |
Step 6: Explore the Dashboard
After opening a dashboard, use the dropdown filters at the top to focus on a specific instance.
| Variable | Applies to | What to select |
|---|---|---|
| namespace | All dashboards | Namespace where your MySQL is deployed (e.g., demo) |
| MySQL | All dashboards | Name of your MySQL instance (e.g., mysql-grafana-demo) |
| pod | Pod dashboard | A specific pod, or All for an aggregated view |
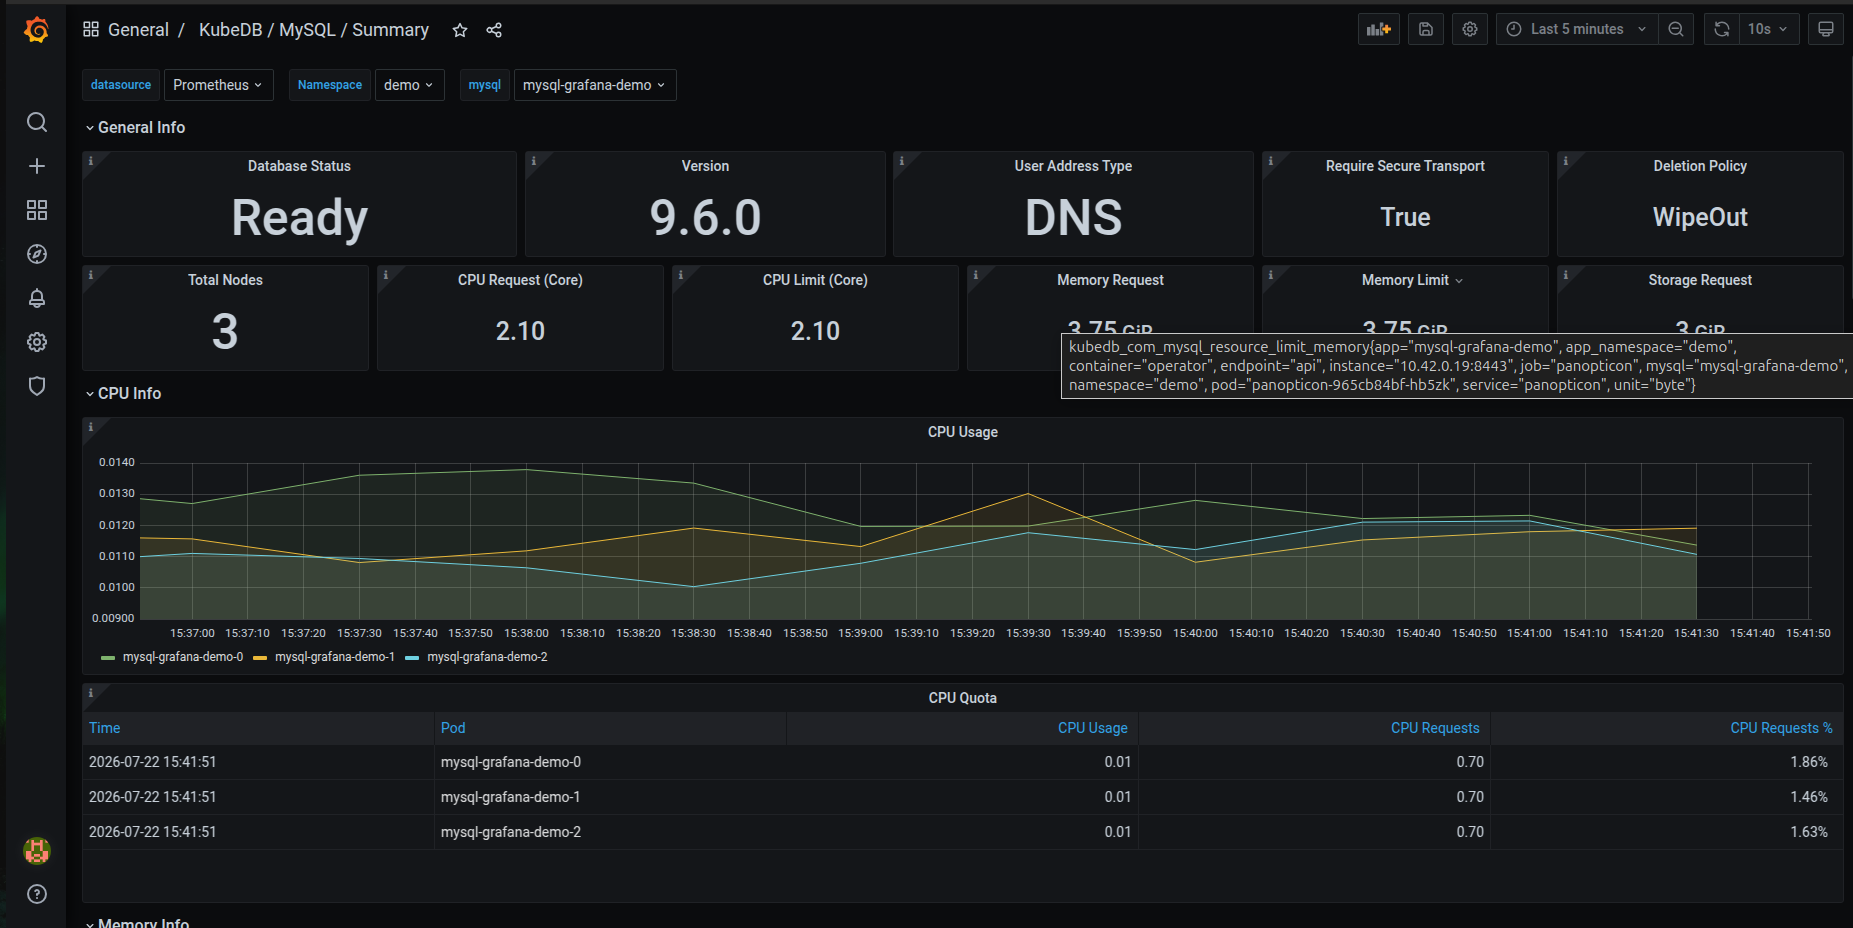
KubeDB / MySQL / Summary — start here for an instance overview:
- General Info — database status, version, user address type, whether secure transport is required, deletion policy, total nodes
- Resource Requests / Limits — configured CPU, memory, and storage requests and limits
- CPU Info / CPU Quota — per-pod CPU usage over time and quota utilization
- Memory Info — memory usage over time and per-pod quota utilization
KubeDB / MySQL / Pod — drill into a specific pod:
- MySQL Pod Summary — pod name, uptime, version, current QPS, InnoDB buffer pool size per pod
- Pod CPU, Memory and File Descriptor Stats — per-pod CPU usage, memory usage, open file descriptors
- Connections — MySQL connections and aborted connections
- Client Threads — client thread activity and thread cache
KubeDB / MySQL / Database — per-pod service and throughput metrics:
- Service Status / Uptime — per-pod health and how long each pod has been serving
- Current QPS — query throughput per pod
- MySQL Connections — current vs. max connections per pod
- MySQL Disk Reads vs Writes — per-pod disk I/O throughput
- MySQL Network Received vs Sent — per-pod network throughput
KubeDB / MySQL / Group Replication — replication group health:
- Group Replication Node Title — ONLINE/OFFLINE status of each member
- Primary Node — which member currently holds the PRIMARY role
- Replication Lag — per-member lag behind the primary
- Transport Time / Replication Delay — time spent transporting and applying transactions
Cleaning up
# Remove the MySQL instance
kubectl delete mysql -n demo mysql-grafana-demo

# Remove namespaces
kubectl delete ns demo

# Uninstall monitoring stack (optional)
helm uninstall prometheus -n monitoring
helm uninstall panopticon -n kubeops
kubectl delete ns monitoring kubeops
Next Steps
- Monitor your MySQL database with KubeDB using built-in Prometheus.
- Monitor your MySQL database with KubeDB using Prometheus Operator.
- Want to hack on KubeDB? Check our contribution guidelines.